01
Engine light
Summarizes the economy
Combines dozens of public economic indicators into one green, yellow or red signal for your business.
 Profit Engine Scorecard
Your bank balance says one thing. Your pipeline says another. The economy says something else. The Profit Engine Scorecard pulls all three into one live view and gives you a simple light: green, yellow or red. AI-written insights tell you what changed and what to look at next.
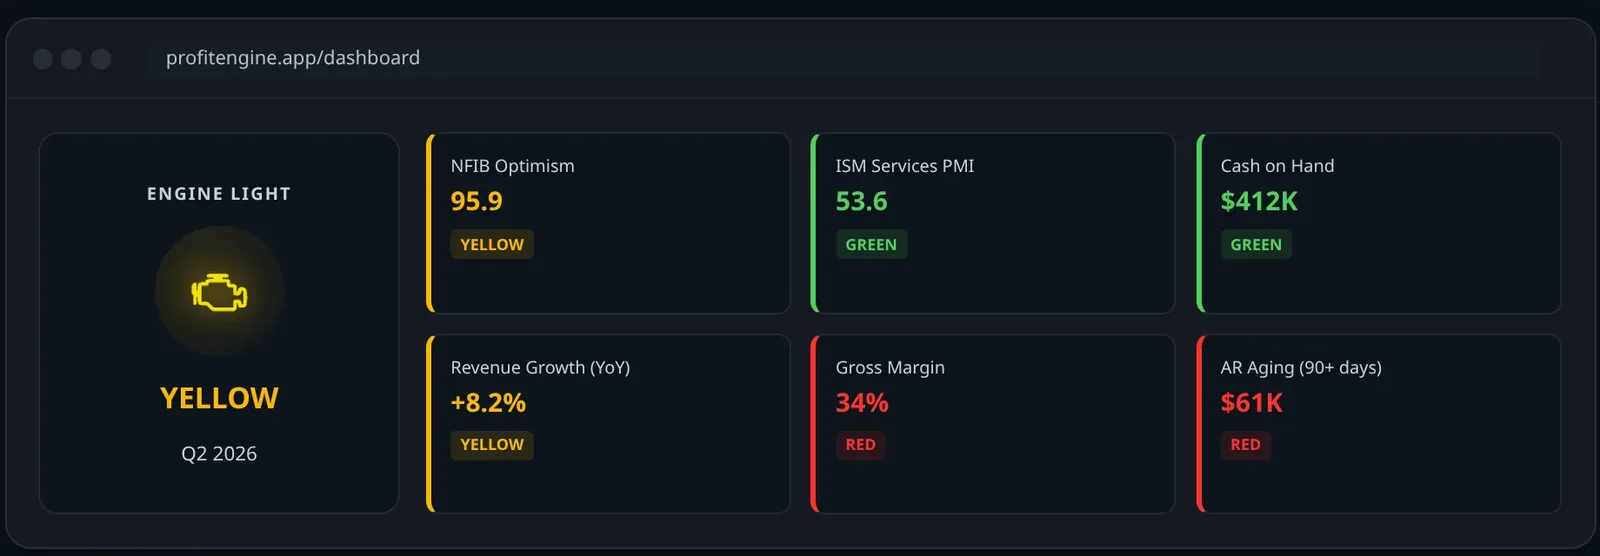
The Profit Engine Scorecard is a live dashboard for owner-led businesses. It combines financial health from QuickBooks, sales pipeline activity and economic indicators into one view, then summarizes them as an economic check engine light: green, yellow or red. AI-written insights explain what changed and where to focus next.
| Built by | SMB Strategy Consultants |
|---|---|
| Made for | Owner-led small businesses |
| Connects to | QuickBooks, Google Sheets, CRM |
| Signature | The economic check engine light |
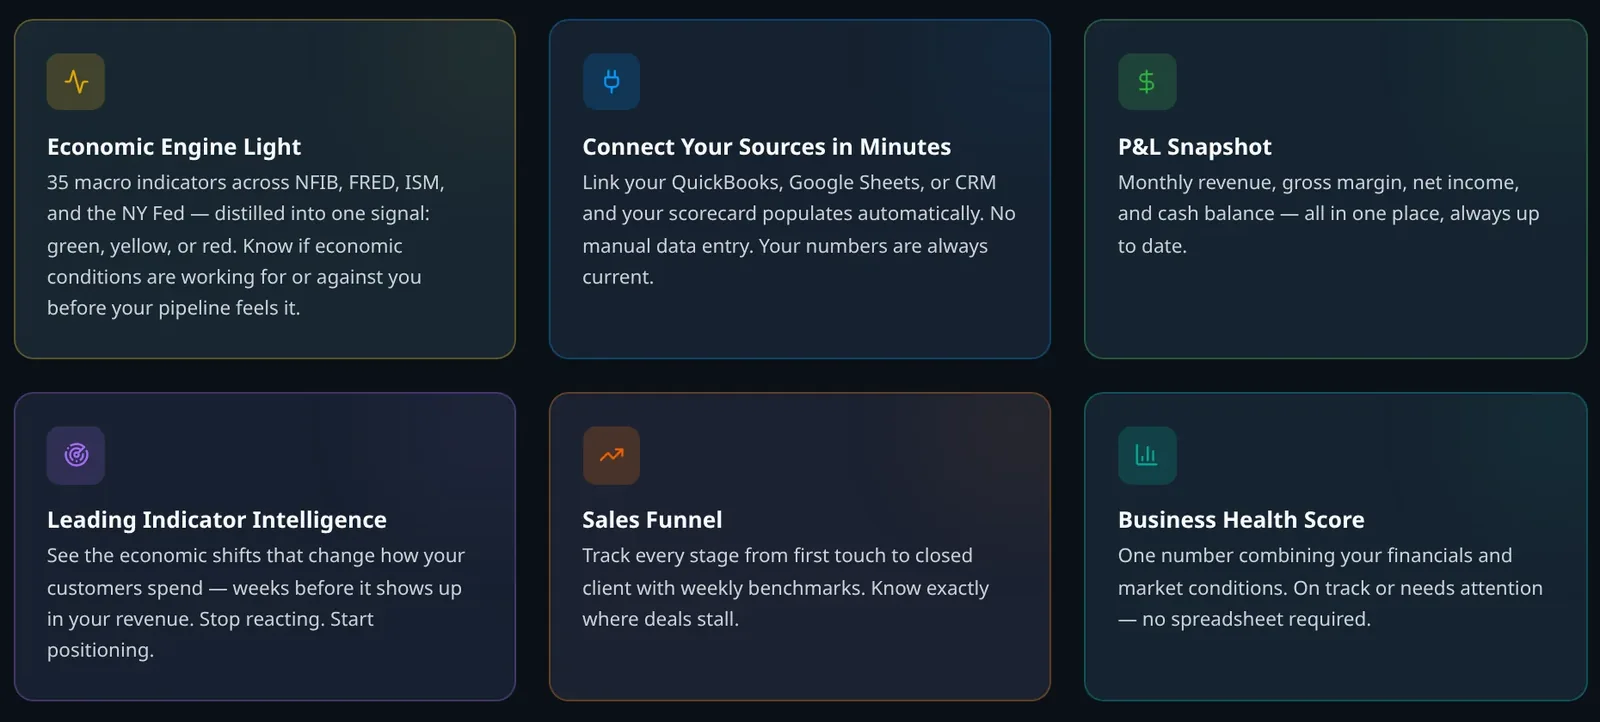
The Scorecard keeps an eye on the signals you would check if you had time every morning, and turns them into a few clear signals.
Summarizes the economy
Combines dozens of public economic indicators into one green, yellow or red signal for your business.
Tracks financial health
Pulls revenue, margin, cash and receivables from your books so they are always current.
Follows the sales funnel
Shows each stage from first touch to closed client and where deals stall.
Explains what changed
Writes plain-language insights on the shifts that could affect how your customers spend.
Economic conditions shape your sales weeks before they show up in revenue. The Scorecard puts the check engine light next to revenue, gross margin, cash, aging receivables and your sales funnel, so you can adjust before the bank balance feels it. Connect your sources once and it stays current.
Link QuickBooks, your CRM or a Google Sheet.
See your numbers, pipeline and engine light in one view.
Get plain-language notes on what changed and why it matters.
Adjust spending, hiring or sales focus before problems show up in the bank.
Nothing. It watches, summarizes and explains. You and your advisor decide what to do.
You want one place to check the health of the business without opening five tools.
You want a shared scoreboard for weekly meetings so everyone sees the same numbers.
You want a simple way to show clients what is changing and why it matters.
It is a single green, yellow or red signal built from public economic indicators. Like the light in your car, it tells you when something deserves a closer look before it turns into a bigger problem.
No. Connect QuickBooks, your CRM or a Google Sheet and the scorecard updates on its own.
No. Your accounting software records transactions. The Scorecard combines your financials with your pipeline and the economy, and explains what they mean together.
Yes. It works well as a shared scoreboard for leadership meetings. You decide who has access.
A demo is a short, live walkthrough built around your situation. We will show you where the agents save the most time and answer questions about fit and timing.
Prefer to explore first? Visit profitenginescorecard.com ↗
Tell us a little about you. We will reach out to set up a time that works, usually within one business day.
 BigMo Sales RepAn AI sales assistant that handles everything around the sale.
 AgentStackOSAn agentic operating system that runs a growth program for every agency client.
 CFO Clarity LayerAn AI CFO team that preps monthly advisory for accounting firms.
 Expense Control HubProtect profit first, then fit every expense under a Salary Cap.